Ten days to a market-ready build
I built a Power BI visual you can seriously use — in ten days, AI-assisted — and then ran the numbers on what the same build would have cost the traditional way. The result is an evidence-based thesis paper: every figure traceable to the public Git history, valuations done with recognized methods, every claim carrying an evidence label. Here is the essence — the full paper is linked below as PDF and web version.
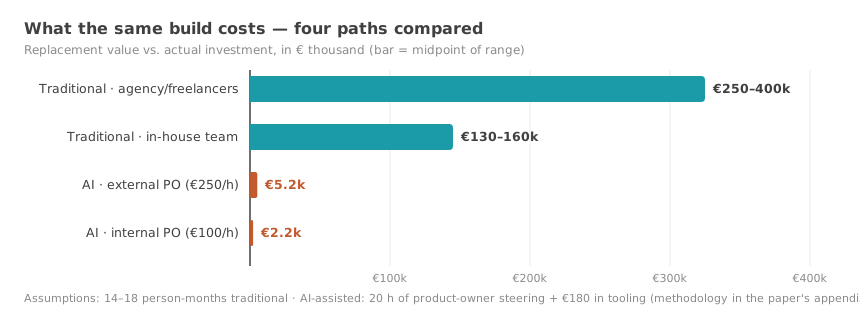
The case in three sentences: Twelve chart types, a controlling table with hierarchy, four languages, 80+ automated render tests — built in ten calendar days, steered by one person who never typed a line of code. Commissioned traditionally, my estimate lands at 14 to 18 person-months, somewhere between €150,000 and €350,000 S. What it actually cost me: about 20 documented hours of steering and €180 in tooling M.
Why the costs are so different
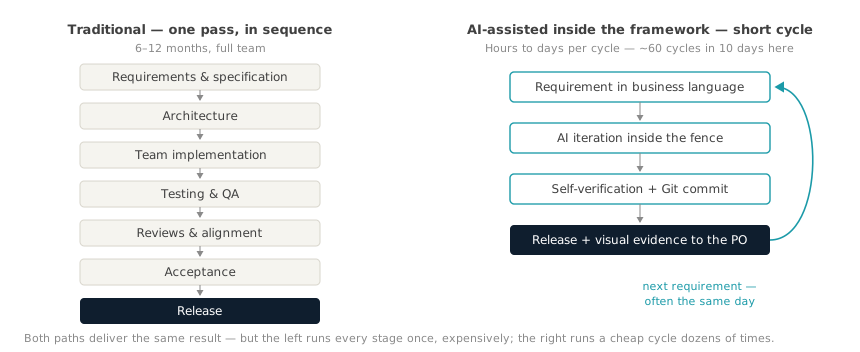
The difference is not in the hourly rates — it is in the process. The traditional path runs every stage once, expensively and in sequence. The AI-assisted path runs a short, cheap cycle dozens of times. In this project: about 60 release cycles in ten days, often several on the same day.
The actual insight: not the AI
It is not the AI alone. It works because four things come together: AI × a fixed framework × domain expertise × Git. Remove one, and the whole thing tips over.
- Fixed frameworks like Power BI visuals, Office add-ins or dbt packages narrow the solution space until AI development becomes controllable and repeatable. The most error-prone layers of traditional projects simply do not exist — and the sandbox caps the damage structurally.
- Domain expertise in the steering seat is the difference between two iterations and twenty: requirements in business language, with a built-in quality yardstick.
- Git is what makes the speed defensible: every step is reviewable, reversible, auditable. Without version control none of this would be worth anything — with it, all 124 steps are publicly traceable.
This is also why the paper matters beyond the single case: absolute productivity factors will change with every model generation. The mechanism — a tight fence, small iterations, fast local verification — will not.
What it means economically
The paper cross-checks the replacement value with three recognized methods (bottom-up, COCOMO II, function points) and frames build vs. buy as a present-value comparison: from roughly 30 to 45 report users onward, building beats licensing S. And a credible free tool already shifts license negotiations — without anyone switching H.
What the paper does not claim
That AI replaces developers · that every piece of software takes ten days · that every domain gets the same results · that a single case (n = 1!) proves a market trend. That is why every claim carries an evidence label: M measured · A assumption · S estimate · H hypothesis. It is built as a thesis paper — to be recalculated and to be contradicted. Both are explicitly welcome.Read the full paper
With every calculation shown: cost leverage, DCF, sensitivities, a governance chapter, sources — and an open invitation to replicate. Available in English and German.
The LinkedIn version to take away
If you want to share the essence — here is the short version to copy:
Weekend read, if you are into this sort of thing: I documented how far AI-assisted development really goes on Power BI.

I built a Power BI visual you can seriously use — in ten days. Twelve chart types, a controlling table with hierarchy, four languages. Commissioned traditionally, my estimate lands at 14 to 18 person-months, somewhere between €150,000 and €350,000. What it actually cost me: about 20 documented hours of steering and €180 in tooling.

What I learned along the way:

It is not the AI alone. It works because four things come together: AI, a fixed framework, domain expertise, and Git. Remove one, and it tips over.

Fixed frameworks like Power BI visuals, Office add-ins or dbt packages narrow the solution space until AI development becomes controllable and repeatable. That, I think, is the real insight — and it stays valid when the next model generation arrives.

Without version control, none of it would have been worth anything. Git is what makes the work reviewable and reversible. All 124 commits of the project are public.

Calculated honestly — same scope on both sides — a cost leverage of 13 to 93 remains. And from roughly 30 to 45 report users onward, building beats licensing on present value.

What the paper does not say: that AI replaces developers, that every piece of software takes ten days, or that a single case proves a market trend. Every claim is labeled as measured, assumption, estimate, or hypothesis.

If you want to recalculate or push back: please do. That is exactly what it was written for.

#PowerBI #Controlling #AI #BuildVsBuy
Source code, Git history and the thesis paper are public — every figure can be recalculated. A single case study proves no rule; it asks a precise question. Contradicting cases are at least as welcome as confirming ones.
📄 This page as Markdown